Save Here. Go Anywhere.
The Maryland College Investment Plan is an investment vehicle designed to help families save for future education and help limit the accumulation of debt.
For 25 years, the Investment Plan has helped more than a quarter-million account owners save for a brighter future for their families.
Whether your child chooses to attend a college, an apprenticeship, or trade school in Maryland or out of state, the Plan is flexible to fit their needs.
THE BENEFITS OF OUR PLAN
Why Save with the Maryland College Investment Plan?
Your child has big dreams about a future where they can be anything they want to be. A Maryland College Investment Plan account is flexible to help them pursue those dreams.
Affordable and Available—Open an account for anyone at any time with as little as $25. You could be a new parent or a grandparent, but you don't need to be related to the beneficiary, and residency in Maryland is not required. You can even open an account for yourself. There are no age or income restrictions for beneficiaries.
Investment Options—Choose from a variety of investment options according to your investment comfort level and the number of years until you will first use your savings. Our historical portfolio performance is updated daily to show you the up-to-date standardized total returns of our investments.
Flexibility—Any earnings are Maryland and federally tax-free1 when used for qualified education expenses throughout the U.S. at nearly any public/private college, trade/technical school, and registered apprenticeship program—or even at some international universities.
Gifting—Invite friends and family to be a part of your savings journey by gifting with a Ugift® code that links directly to your account.
Growth Potential—Get more from your savings. Our plan offers the growth potential of higher tax-advantaged returns compared to lower-yielding bank accounts.2 Every contribution can add up. The more you are able to save today means the less you may have to borrow tomorrow.
Owner Managed—Save for education your way. Choose how much and how often you want to invest based on your budget and goals. With some exceptions, account owners, rather than the beneficiaries, maintain control of the funds in the account even if plans change.
State Contribution Program—You could be eligible to receive a $250 or $500 contribution from the State of Maryland through the Save4College State Contribution Program.
Tax Benefits—Your contributions may be eligible for a State income subtraction for Maryland taxpayers on contributions of up to $2,500 per beneficiary each year.
280,000 Savers
We've helped over a quarter-million account owners invest in a brighter future
$11 Billion
Over $11 billion in assets under our management
400,000 Accounts
There are more than 400,000 Investment Plan accounts
Investment options
Choose a Target Year Portfolio or DIY. You Have Options.
Choose the investment option that best meets your goals. We've got options – you can save for education your way.
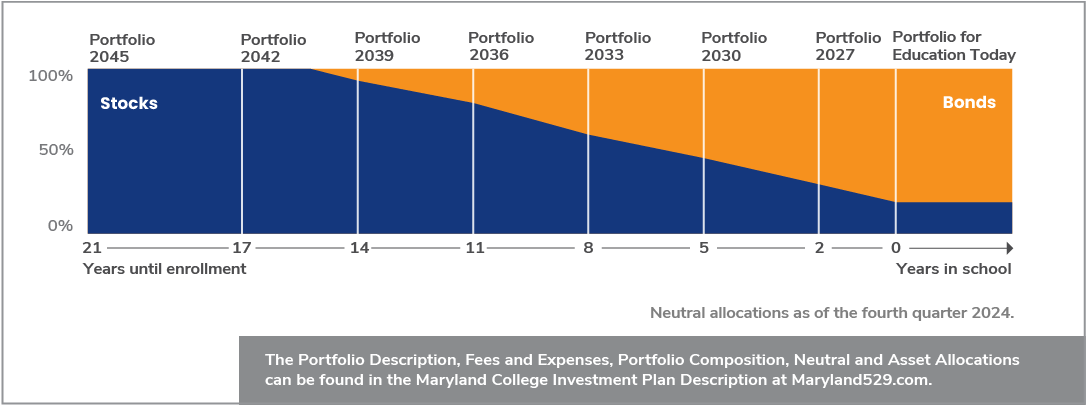
Enrollment-Based Portfolios are target-date investments with allocations that change automatically based on time horizon.
These portfolios automatically adjust their investment mix from more aggressive to more conservative as the enrollment year approaches. Portfolios with a longer time horizon emphasize stock mutual funds for their growth potential, and then shift to an emphasis on bond investments.
Investment Option Allocations
Each Enrollment-Based Portfolio below is composed of various T. Rowe Price mutual funds.* When the target enrollment year is further off, the portfolio starts with a greater exposure to stocks to focus on growth potential and then shifts over time to bond funds, with the goal of reducing risk and volatility as the target enrollment year nears.
The allocations shown in the pie chart are as of the fourth quarter of 2025. The detailed allocations for each portfolio are available in the Plan Description.
Portfolios
Use the select box or range slider to choose the number of years until you will first use your savings.
- Portfolio 2045, 100% stocks, 0% bonds
- Portfolio 2042, 100% stocks, 0% bonds
- Portfolio 2039, 92.50% stocks, 7.50% bonds
- Portfolio 2036, 77.50% stocks, 22.50% bonds
- Portfolio 2033, 61.75% stocks, 38.25% bonds
- Portfolio 2030, 45.75% stocks, 54.25% bonds
- Portfolio 2027, 28.50% stocks, 71.50% bonds
- Portfolio for Education Today, 20% stocks, 80% bonds
General Information:
The allocations for each underlying fund are as of the most recent Plan Description and related supplements; the current allocations may be higher or lower than shown.
T. Rowe Price mutual funds compose the underlying investments of each of the portfolios.
*The principal value of the Enrollment-Based Portfolios is not guaranteed at any time, including at or after the target enrollment date. The portfolios invest in a broad range of underlying mutual funds that include stocks, bonds, and short-term investments and are subject to the risks of different areas of the market. The portfolios emphasize potential capital appreciation during the early phases of asset accumulation, balance the need for appreciation with the need for income as matriculation approaches, and focus more on income and principal stability after matriculation. While moving assets into bond and money market funds can help lower investment risks, there is no guarantee against loss. The portfolios maintain a substantial allocation to equities both prior to and after the target enrollment date, which can result in greater volatility.
Fixed portfolios that can be combined to create a custom mix or used individually to access specific markets.*
Select and customize your own portfolio, choosing from our list of fixed portfolios to best match your timeframe and investment strategy. As your target date comes closer or if your situation changes, you can adjust your investments up to twice a year or your future allocations at any time.
Investment Option Allocations
Fixed Portfolios offer specific asset classes that are composed of various mutual funds. With Fixed Portfolios, the asset allocations do not shift over time but that doesn’t mean you don’t have control or flexibility. You can move your assets to a more conservative or aggressive portfolio up to two times per year per beneficiary. Please note that all investments are subject to market risk, including the potential loss of principal.
Portfolio Details

-
Equity Index 500 Portfolio
100% stocks100% stocksThis portfolio invests in the T. Rowe Price Equity Index 500 Fund**, which is a passively managed index fund seeking to match the performance of the S&P 500® Index, a well-known index consisting primarily of large-capitalization U.S. stocks. Index funds seek to match the investment return of a particular benchmark index and generally do not reallocate their holdings based on changes in market conditions or outlook. As a result, the expenses of passively managed index funds are typically lower than the expenses of actively managed funds. This portfolio does not become more conservatively allocated over time and is designed for account owners who want a portfolio composed of a passively managed U.S. large-capitalization equity mutual fund. This strategy is based on the understanding that the volatility associated with the U.S. large capitalization equity markets can be accompanied by the potential for long-term capital appreciation. The detailed asset allocations for this portfolio are available in the Plan Description.
-
Equity Portfolio
100% stocks100% stocksEmphasizing long-term capital appreciation, this equity portfolio invests in a broad range of funds focused on both domestic and international equity markets. It is designed for account owners who want a broadly diversified portfolio composed primarily of actively managed equity mutual funds. Because this portfolio invests in many underlying funds, it will have partial exposure to the risks of different areas of the market. This strategy is based on the understanding that the volatility associated with equity markets may be accompanied by the greatest potential for long-term capital appreciation. The detailed asset allocations for this portfolio are available in the Plan Description.
-
Extended Equity Market Index Portfolio
100% stocks100% stocksThis portfolio invests in the T. Rowe Price Mid-Cap Index Fund and the T. Rowe Price SmallCap Index Fund. These are passively managed funds seeking to track the performance of a benchmark index that measures the investment return of U.S. mid- and small-cap stocks. Index funds seek to match the investment return of a particular benchmark index and generally do not reallocate their holdings based on changes in market conditions or outlook. As a result, the expenses of passively managed index funds are typically lower than the expenses of actively managed funds. This portfolio is designed for account owners who want a portfolio composed of a passively managed U.S. equity mutual fund tracking the performance of the small- and mid-capitalization U.S. stock market. This strategy is based on the understanding that the volatility associated with index investing and the U.S. small- and mid-capitalization equity markets can be accompanied by the potential for long-term capital appreciation. The detailed asset allocations for this portfolio are available in the Plan Description.
-
Global Equity Market Index Portfolio
100% stocks100% stocksThis portfolio invests in the T. Rowe Price Equity Index 500 Fund, the T. Rowe Price Mid-Cap Index Fund, and the T. Rowe Price Small-Cap Index Fund, which are passively managed index funds seeking to track the performance of the entire U.S. stock market, and the T. Rowe Price International Equity Index Fund, which is a passively managed index fund seeking to track the performance of stocks in developed non-U.S. markets. Index funds seek to match the investment return of a particular benchmark index and generally do not reallocate their holdings based on changes in market conditions or outlook. As a result, the expenses of passively managed index funds are typically lower than the expenses of actively managed funds. This portfolio is designed for account owners who want a portfolio composed of passively managed equity mutual funds. This strategy is based on the understanding that the volatility associated with index investing and the global equity markets may be accompanied by the potential for long-term capital appreciation. The detailed asset allocations for this portfolio are available in the Plan Description.
-
Balanced Portfolio
60% stocks40% bonds60% stocks40% bondsThis moderately aggressive portfolio seeks capital appreciation and income and focuses on a mix of approximately 60% of its holdings invested in equity markets, including exposure to international stocks, while seeking diversification through approximately 40% of its holdings allocated to fixed income. This strategy is based on accepting the risks associated with stocks, which have the potential to provide high returns, and seeking to balance the effects of volatility through diversification in fixed income securities. The detailed neutral allocations for this portfolio are available in the Plan Description.
-
Bond and Income Portfolio
0% stocks100% bonds0% stocks100% bondsThis portfolio’s primary objective is to seek a high level of current income consistent with moderate price fluctuations by investing exclusively in the T. Rowe Price Spectrum Income Fund. The strategy is based on a lower-risk investment approach that seeks to conserve principal and generate a reasonable level of return while minimizing the risks associated with equity markets. The detailed asset allocation for this portfolio is available in the Plan Description.
-
Inflation Focused Bond Portfolio
0% stocks100% bonds0% stocks100% bondsThis portfolio seeks a level of income that is consistent with the current rate of inflation by investing exclusively in the T. Rowe Price U.S. Limited Duration TIPS Index Fund. Under normal conditions, the fund invests at least 80% of its net assets in treasury inflation protected securities and securities that are held in its benchmark index. The detailed asset allocation for this portfolio is available in the Plan Description.
While certain portfolios seek to cushion the effects of volatility in U.S. equity markets by diversifying in foreign markets and/or fixed income markets, diversification cannot assure a profit or protect against loss in a declining market.
-
U.S. Bond Index Portfolio
0% stocks100% bonds0% stocks100% bondsThis portfolio invests in the T. Rowe Price QM U.S. Bond Index Fund, which is a passively managed index fund seeking to match or incrementally exceed the performance of the U.S. investment-grade bond market. Index funds seek to match the investment return of a particular benchmark index and generally do not reallocate their holdings based on changes in market conditions or outlook. As a result, the expenses of passively managed index funds are typically lower than the expenses of actively managed funds. This portfolio is designed for account owners who want a portfolio composed of a passively managed bond mutual fund and can accept the volatility associated with index investing and U.S. investment-grade bonds. The detailed asset allocation for this portfolio is available in the Plan Description.
-
Social Index Equity Portfolio
100% stocks100% stocksThis portfolio invests in the Vanguard FTSE Social Index Fund***, which is a passively managed fund designed to track the performance of the FTSE US Choice Index. This index, which is market-capitalization weighted, is composed of large- and mid-cap stocks of companies that are screened for certain environmental, social, and corporate governance (ESG) criteria by the index sponsor, which is independent of Vanguard. The detailed asset allocation for this portfolio and more information about the FTSE US Choice Index is available in the Plan Description.
-
U.S. Treasury Money Market Portfolio
100% money market100% money marketThis portfolio seeks to preserve investment principal, while providing the highest available current income, by investing exclusively in the T. Rowe Price U.S. Treasury Money Fund, which is a money market fund managed to provide a stable share price of $1.00 by investing in short-term securities backed by the U.S. government and repurchase agreements thereon. The detailed asset allocation for this portfolio is available in the Plan Description.
You could lose money by investing in this portfolio. Although the U.S. Treasury Money Market Portfolio seeks to preserve the value of your investment, at $1.00 per share, it is possible to lose money by investing in this portfolio. Neither the program manager nor the underlying fund’s sponsor has any legal obligation to provide financial support to the underlying fund, and you should not expect that either the program manager or the fund sponsor will provide financial support to the portfolio or the underlying fund at any time.
General Information:
The portfolio description and allocations for each underlying portfolio are as of the most recent Plan Description and related supplements; the allocations may be higher or lower than shown. Please see the Plan Description and related supplements for the most recent portfolio description, portfolio composition, and neutral allocation information.
T. Rowe Price mutual funds compose the underlying investments of each of the portfolios.
*All investments are subject to market risk, including possible loss of principal. Stocks can decline for many reasons, including adverse political or economic developments here or abroad, changes in investor psychology, or heavy institutional selling. Bonds may decline in response to rising interest rates, a credit rating downgrade, or failure of the issuer to make timely payments of interest or principal. Foreign investments are subject to additional risks, including potentially adverse political and economic developments overseas, greater volatility, less liquidity, and the possibility that foreign currencies will decline against the dollar.
**S&P Dow Jones Indices LLC, a division of S&P Global, or its affiliates (“SPDJI”), and has been licensed for use by T. Rowe Price. Standard & Poor’s® and S&P® are registered trademarks of Standard & Poor’s Financial Services LLC, a division of S&P Global (“S&P”); Dow Jones® is a registered trademark of Dow Jones Trademark Holdings LLC (“Dow Jones”); and these trademarks have been licensed for use by SPDJI and sublicensed for certain purposes by T. Rowe Price. The Maryland College Investment Plan is not sponsored, endorsed, sold or promoted by SPDJI, Dow Jones, S&P, their respective affiliates and none of such parties make any representation regarding the advisability of investing in such product(s) nor do they have any liability for any errors, omissions, or interruptions of the S&P 500® Index.
***The fund is subject to ESG investing risks. The index provider selects securities for the Index based on the ESG criteria disclosed in the fund’s principal investment strategies. Using ESG criteria could result in the fund investing in securities that trail the returns of other funds that use ESG criteria or in the fund underperforming the market as a whole. The index provider’s use of ESG criteria may result in the Index becoming focused, at times, in a particular market sector, which would subject the fund to proportionately higher risks of that sector. Interpretations of what it means for a company or issuer to exhibit ESG characteristics can – and do – vary significantly across individuals, index providers, advisors, and other funds that use ESG criteria. As a result, the fund’s disclosed ESG criteria, or the index provider’s assessment of whether or not a company or issuer meets the fund’s disclosed ESG criteria, may not align with your personal view of what it means for a company or issuer to exhibit ESG characteristics. Further, individual securities held by the fund may not reflect your personal preferences, beliefs, expectations, and/or values. In order to assess a company or issuer against the fund’s disclosed ESG criteria, the index provider depends on the availability of data obtained through voluntary or third-party reporting. There can be no assurance that this data will be accurate, complete, or current, which could result in an inaccurate assessment of a company or issuer.

Morningstar, Inc., “Silver” Rating
The Maryland College Investment Plan was one of only 13 plans to receive a "Silver" rating by Morningstar, Inc. in 2025.
Silver-rated 529 plans sport a combination of superior investment teams, robust investment processes, and/or good state stewardship that benefits participants.3

Top 10 Performance
The Maryland College Investment Plan was ranked #1 for 529 plan enrollment-based portfolio performance in the ten-year period, #4 in the five-year period, and #1 in the three-year period as of 3/31/26.
Saving For College conducts quarterly evaluations of the investment performance of thousands of 529 enrollment-based portfolios and ranks the plans based on the results.4 According to Saving For College, the rankings are "…a helpful tool for families and financial professionals looking to compare college savings options."
Saving For College has been the leading independent authority on 529 savings plans since 1999. The site compiles and analyzes data and creates content and tools to provide parents, financial professionals, and state policymakers with resources to help them understand how to meet the challenge of ever-increasing education costs.
2025 “Top of the Class” Award
The Maryland College Investment Plan earned the “Top of the Class” designation from Saving for College in their 2025 529 Ratings, placing it among only 8 direct-sold 529 plans recognized.5 This award signifies that these plans have outperformed more than 80% of their peers in the category.
OPENING AN ACCOUNT
How to Open a Maryland College Investment Plan Account
Take the first step on your education savings journey today.
Open a College Investment Plan Account
With the College Investment Plan managed by T. Rowe Price, an investment management firm with more than 80 years of experience, you can save for your child’s future education on your terms.
Choose an Investment Option
We offer a variety of investment options whether you are new to investing or prefer a hands-on approach.
Contribute All at Once or Save Regularly
Once you open an account, you can tailor your contributions to your current budget. It’s easy to save with a one-time contribution or recurring contributions with the option of increasing over time.
Recurring ContributionsPLAN TOOLS & RESOURCES
The Maryland College Investment Plan offers the following additional features, tools, and resources.

YOUR SAVINGS JOURNEY
We're Here to Guide You Along the Way
As a Maryland College Investment Plan account owner, we’ll be with you every step of the way throughout your education savings journey. We have tools and content designed to help you when you need it most, whether you have a newborn baby or your child is already a teenager.
Boost Their Future With Ugift®
Friends and family can join in the excitement, contributing to your child’s educational future with Ugift. All gifts that are invested into your child’s College Investment Plan account are intended to be used for qualified education expenses.
Visualize Their Future
The College Financing Planner provides customized projections to estimate your future college expenses. Use this tool to create a savings plan to achieve your college funding goals.
1 There may be tax implications for Maryland taxpayers who take a distribution for the education loan of a sibling of the beneficiary. Maryland 529 cannot and does not provide tax advice. Your tax consequences depend on your individual circumstances. If you withdraw funds that are not used for qualified education expenses, any earnings on that distribution may be subject to income taxes and a 10% federal penalty. In addition, there may be Maryland tax consequences for your contributions. State tax laws and treatment may vary. So, check with a tax professional regarding your specific situation.
2 Unlike a traditional bank account that offers Federal Deposit Insurance Corporation (FDIC) protection, investments in 529 plans are generally not guaranteed, and you could lose money, including your principal, by investing in them. There may be other material differences between savings accounts and 529 college savings plan accounts that should be considered prior to investing.
3 Morningstar analysts reviewed 59 plans for its 2025 ratings (11/10/25), of which 13 plans received a "Silver" rating. To determine a plan's rating, Morningstar's analysts organized their research around 4 key pillars: Process, People, Parent, and Price. Plans were then assigned forward-looking ratings of "Gold," "Silver," "Bronze," "Neutral," and "Negative." Each year, certain of the industry's smallest plans are not rated. Click here for additional information about Morningstar's methodology.
Analyst Ratings are subjective in nature and should not be used as the sole basis for investment decisions. Analyst Ratings are based on Morningstar analysts' current expectations about future events and, therefore, involve unknown risks and uncertainties that may cause Morningstar's expectations not to occur or to differ significantly from what was expected. Morningstar does not represent its Analyst Ratings to be guarantees.
©2026 Morningstar, Inc. All rights reserved. The information contained herein: (1) is proprietary to Morningstar and/or its content providers; (2) may not be copied or distributed; and (3) is not warranted to be accurate, complete, or timely. Neither Morningstar nor its content providers are responsible for any damages or losses arising from any use of this information. Past performance is no guarantee of future results.
4 Each quarter, Saving For College analyzes the investment performance figures for thousands of 529 portfolios, comparing the reported investment performance of a subset of portfolios from each 529 savings plan to produce their rankings. As of 3/31/26, the rankings for the Maryland College Investment Plan were: 1 out of 17, 4 out of 43, 1 out of 48, and 14 out of 52 for the 10-, 5-, 3-, and 1-year periods, respectively. Saving For College compares historical investment returns for all enrollment-based portfolios, including age-based and year-of-enrollment portfolios, within a given age band from 0 to 19+. A hypothetical average annual return is then calculated for each plan's enrollment-based portfolios along a glide path from 0 to 19+, and the plans are ranked from highest to lowest return. There are separate comparisons for direct-sold and advisor-sold plans. More information about the methodology and the performance rankings can be found on savingforcollege.com.
5 Saving for College evaluated a total of 85 state-sponsored 529 savings programs for its 2025 Ratings: 55 direct-sold programs and 30 advisor-sold programs. Top of the Class designation was awarded to less than 20% of the evaluated programs in each category. Visit this page for more information on the criteria used in compiling a plans's 529 rating. The factors Saving For College examined and scored for each 529 plan are grouped into four categories: Performance, Ease of Use, Savings Success, and Program Delivery. A plan's four individual category scores are computed on a scale of 1 to 5 and carried out to two decimal places. The overall 529 Rating is a weighted average of these four category scores.
Ugift® is a registered service mark of Ascensus Broker Dealer Services, LLC.
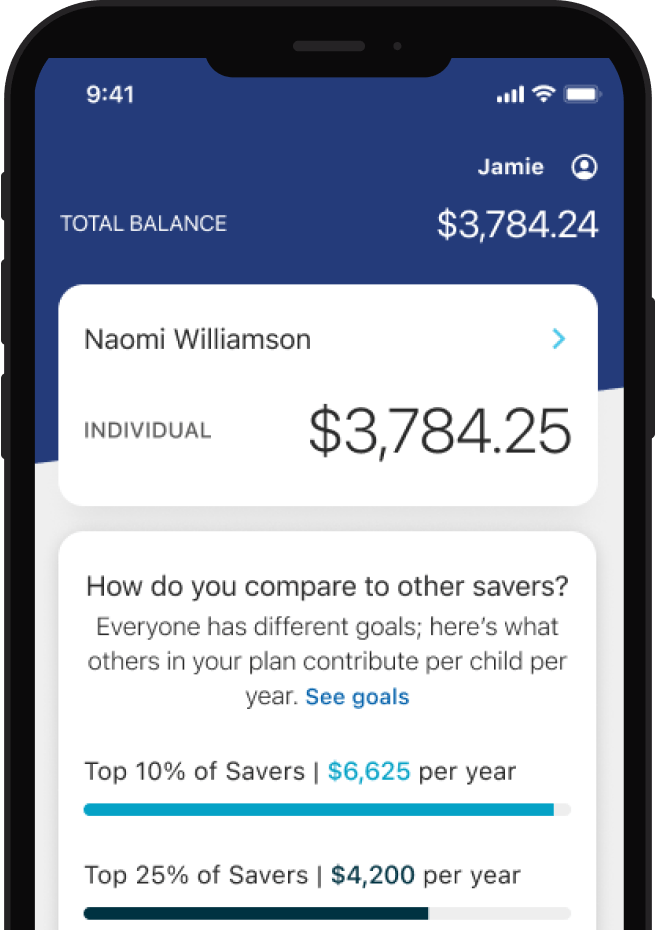
Readysave™ 529 app
Manage your account anywhere, anytime.
Regularly monitor your account
Check your account balance, transaction history, and investment allocations.
Contribute at your pace
Add money to your balance as a one-time or recurring contribution.
Gifting from friends and family
Easily invite friends and family to help give your savings a boost with Ugift®.
Request a distribution
Send money directly to a school or a bank account on file.